SPY is showing a small pre-market pullback while trading close to resistance. MFI remains negative but is starting to turn higher, while flow is still outflow.
Support: $758–763
Resistance: $770–775
50D EMA: ~$761
MFI: Negative, improving
Flow: Outflow
I would remain selective here and focus on adding only long-term names I’m comfortable holding through a deeper correction.
HOLD / SELECTIVE ACCUMULATION ON SUPPORT.
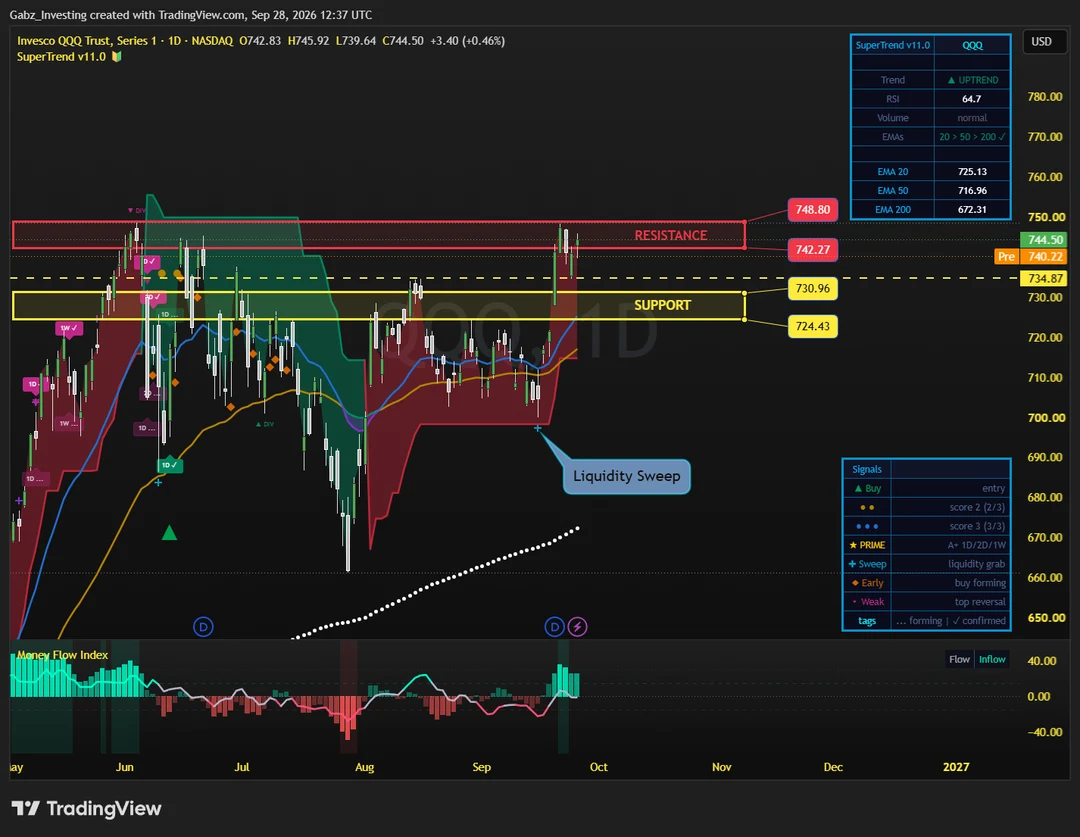
$QQQ — Daily Technical Setup
QQQ remains in a daily uptrend, despite the ~0.5% pre-market pullback. Price is still close to resistance, while MFI is around neutral and flow remains positive with buying volume present.
Support: $724–731
Major Support: ~$735
Resistance: $742–749
20D EMA: ~$725
MFI: Neutral / Slightly Negative
Flow: Inflow
If the correction continues, ~$735 would be the first level I would watch, followed by the broader support zone.
HOLD — BUY ON SUPPORT.
September 5 | One Hot Jobs Number, and Seven Charts Explained
Good morning, beautiful community!
I’m sharing this material for free today to give you a better idea of what you receive as a subscriber. These reports take a significant amount of time and work to put together, and I usually share them with the community once a week, sometimes twice.
The subscription is currently $25/month until early November, when it will increase to $30/month for the Market Update Tier and $60/month for the Beta Tier. I believe the work I put into these reports deserves that adjustment, and I want everyone to have the opportunity to see the value before deciding.
The goal is not just to give you information, but to help you understand how to act, where opportunities may exist, and where market panic or misinterpretation can create an advantage.
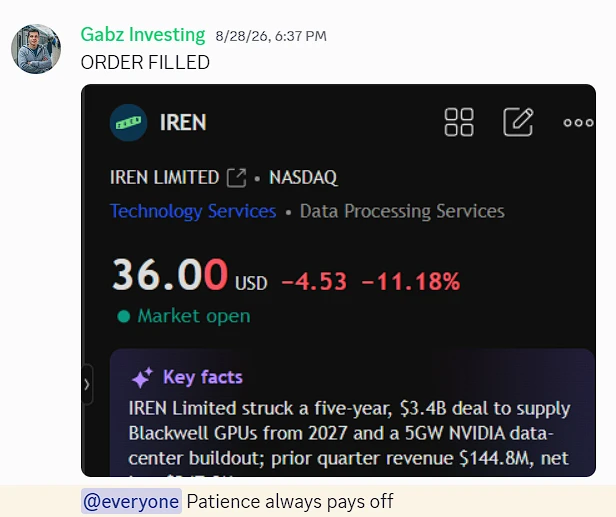
We saw a great example with IREN recently. We added that position at $36, during a period of panic that I believed did not reflect a real reason for concern. Just one week later, we’re looking at returns of more than 25% on that position.
That’s the kind of opportunity I want to help you identify—not by chasing the market, but by understanding it.
If you’re curious about what the community receives, this is a good example of the work that goes into it.
Now, let’s take a closer look at today’s market update…
It’s the weekend, I’ve got my coffee, and I’m sitting here going through the charts one more time before the week starts. I want to walk you through exactly what I’m reading, in plain words, because yesterday gave us a number I did not want to see, and I think the honest thing to do is talk about it openly instead of pretending.
So let me start there.
The jobs report came in the opposite of what I hoped for
On Friday I told you I’d rather see a soft jobs report. Fewer jobs, unemployment ticking up a little. That kind of report keeps the Fed calm and takes a rate hike off the table.
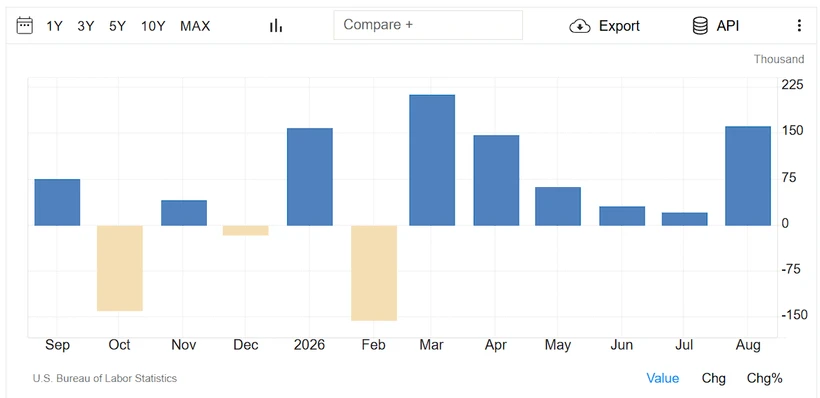
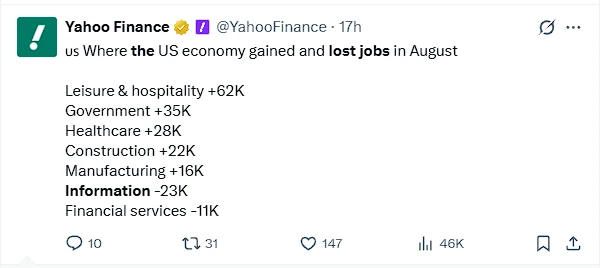
We got the opposite. The US added 162,000 jobs in August, the strongest in five months, and roughly three times what the market expected (around 53,000 to 56,000). Unemployment held at 4.1%. And here’s the part that stings a little: July, which first printed as a loss of 23,000 jobs, was revised all the way up to a gain of 21,000. June and July together were bumped up by 55,000.
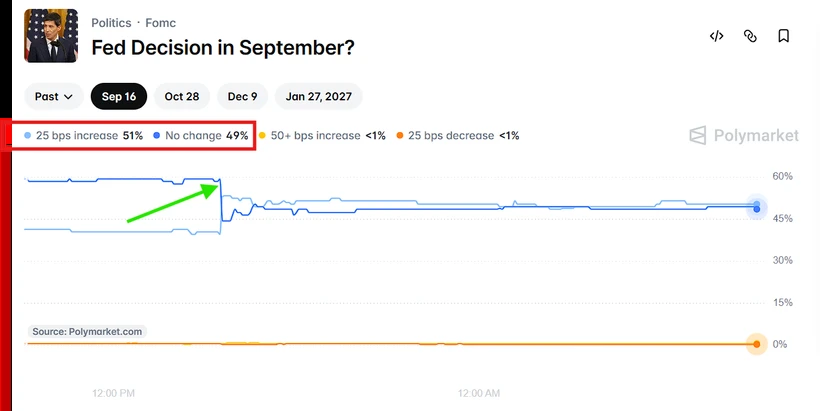
I’m not going to spin this. A hot number like this makes a September rate hike more likely, not less. Right after the report, the market’s odds of a hike jumped from around 55% to about 65% for the meeting on September 15–16. So the thing I’ve been saying for weeks, that the Fed doesn’t hike, is now under real pressure. I still lean that way, but I have to respect what the data did.
This morning’s chart is showing almost 50/50 chances of a 25 bps rate cut and no change. As I’ve stated before, I think rates will remain unchanged.
Two things keep me from panicking, though.
First, look at what kind of jobs these were. The gains came from restaurants and bars, local government schools, and health care. Solid, but not exactly the high-value engine of the economy. And here’s the quiet detail almost nobody is highlighting: the information sector actually lost 23,000 jobs, in computing infrastructure, data processing and web hosting. That’s the tech corner of the labor market shrinking, likely because companies are spending on AI instead of people. So the headline is hot, but the mix is softer than it looks.
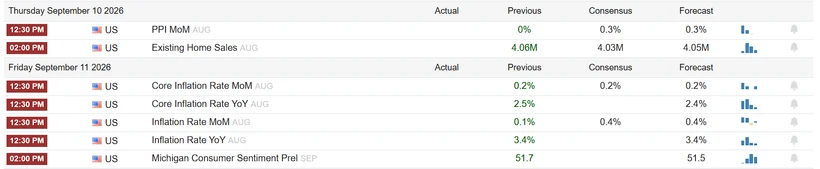
Second, this isn’t the number that decides it. Even the economists calling this strong are saying the same thing I am: next week’s inflation data is what really matters. We get PPI and CPI Thursday and Friday. If inflation comes in cool, the Fed can look at this jobs report and calmly set it aside. That’s the real fork in the road, not Friday.
Now let me zoom out, because when I stop staring at that one number and read the whole board, the picture is a lot calmer.
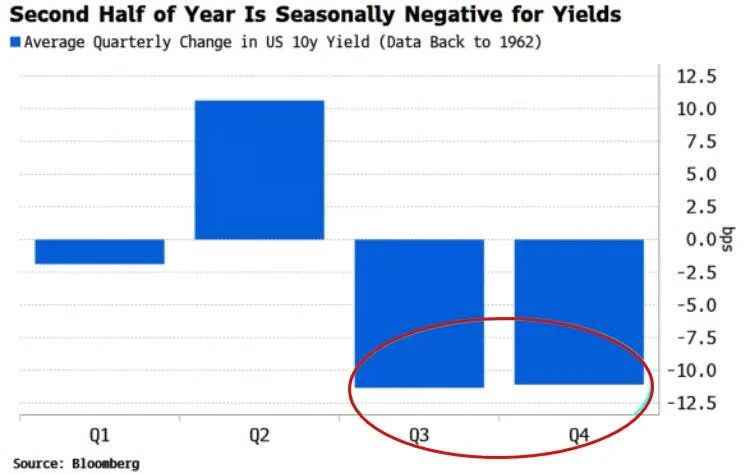
Chart 1: yields usually fall into year-end
There’s a Bloomberg chart going back to 1962 that shows how the US 10-year yield tends to move each quarter. The third and fourth quarters are seasonally the weakest for yields, meaning they usually drift lower, not higher. On average, both quarters have pulled yields down by around 10 basis points.
Why do I care? Because yields are the cost of money, and lower yields are oxygen for stocks. The jobs report pushed yields up on Friday, but the seasonal tide for the rest of the year usually leans the other way. One strong report doesn’t cancel that. It’s a good reminder not to extrapolate a single day into the whole autumn.